
Quick Review
Du Sautoy delves into the past to show how some of the great minds of mathematics solved problems and how their thought process can help you solve yours. The book isn’t dense with mathematics terms but there is some level of maths to understand what he is talking about.
Two Key TakeAways
- Approaching challenges with the rigour of a mathematician can help you be clear on the problem you are facing. Specificity is your friend.
- How you think about the problem chains your mental model. Look at issues from multiple perspectives and avoid your gut response.
Chapter 1 – Departure
Main Point
We can use mathematics or the theories behind it to make complicated and mundane tasks easier and simpler to complete. There is a difference between work we liked to do (hobbies, practice) and work that is the classic understanding of work. We want to make the latter easier so we can have more time for the former.
Summary
Gauss – Mathematics is the art of the shortcut. The story in 1786 of young 9-year-old Carl Friedrich Gauss when been set a difficult task by his strict teacher Herr Buttner to add up all the numbers from 1 to 100. He wanted the whole class to do it so he could sleep. Gauss finished immediately and took up his answer. Buttner didn’t believe him and waited for all the students to finish before checking the answers. Gauss saw that every pair 1 + 100 = 101 and there were 50 pairs so it was just 50 x 101 = 5050.
Getting Further Faster – Humans developed Heuristics as a way of understanding the world. Trying to make the problem less complex, either consciously or unconsciously. The issue is that most heuristics aren’t fit for purpose. “We judge the global by knowledge of the local” PG 4. This worked when we didn’t move very far. We can now use mathematics to look down from about and see a structure when before there was randomness.
The Journey Ahead – We want to use math to help with shortcuts. This could be finding patterns to understand what happens next. Using algebra, algorithms, or calculus to make it easier to understand what to do. The ability to strip out everything that doesn’t matter so you can hone in on what you care about.
Humans versus Machines – Machines have silicon muscle and can answer Gauss’s question in a nanosecond so it doesn’t need to come up with a shortcut. But that gives humans the advantage that we can be creative and think of new ways to do things. Idleness and Laziness are seen as bad things because those people don’t conform to the rules of the game but those people often produce shortcuts because they don’t see the point in doing something that can be done more easily.
Choosing To Work – Not all work is bad. Learning to play something is still work but it is fun so we don’t look at it like work. Aristotle said there were two types of work: Praxis which is something done for its own sake, and Poiesis which is an activity aimed at the production of something useful. Short cuts should be aimed at making poiesis easier so you can spend more time doing praxis.
Chapter 2 – The Pattern Shortcut
Main Point
If you can figure out the pattern you can see into the future. The numbers of the pattern have to stand for something as numbers just being numbers can hide randomness.
Summary
Patterns – An extremely powerful method to understand what will happen in the future.
Planetary Patterns – In 1801, astronomers declared they had found the 8th planet, Ceres, but it quickly disappeared behind the sun. 24-year-old Gauss declared he had found the planet by figuring out the pattern of its movements. It was not a planet, but a comet.
What’s The Number? – Gauss figured out Triangle Numbers when doing his equation in the classroom. To get find the number in the sequence use the formula
1/2 * n * (n+1)
Also, there are Exponential Growth Patterns, to find the number in the sequence you use the formula
X = 2^n – 1
Urban Patterns – Geoffrey West, A Cambridge-educated physicist then went on to study fundamental particles at Stanford applied his learning to cities and found that as a city doubles they get roughly 15% more of things. 15% more restaurants, schools, higher salary, but also crime, disease.
Misleading Patterns – Patterns are very powerful but sometimes the pattern is just random and when you apply a solution to what comes next you will be found wanting. The numbers and data should be describing something, you shouldn’t just look at the numbers.
A Short Cut To A Good Memory – Use patterns to compress the amount of information you need to remember. Like a jpeg or MP3, it compresses the data. The simpler the image the easy it is to compress because the pattern will be shorter.
Climbing The Stairs – The Fibonacci Sequence is found in nature. It was first founded by Tabla Indian musicians. It is adding the two previous numbers together to firm the third. You can break down problems into smaller sections and see if you can find a pattern in a more simple version of the problem.
Connecting Shortcuts – Pascal’s Triangle (even though the Chinese discovered it years earlier) combines many shortcuts depending on how you look at it.
Pitstop – Music – Learning an instrument is like being an athlete, you have to put in the time to create muscle memory. The 10,000 hours idea popularized by Malcolm Gladwell’s Outliers isn’t technically correct. The original researchers said it was a misrepresentation of their findings. Natalie Clein, a professional cellist, talks about its not about the hours, but about learning the correct thing to do. Hungarian Psychologist Mihaly Csikszentmihalyi, created the idea of the flow state. Flow lives at the junction of challenge and skill. It should be hard to be a challenge, but not too hard to be discouraging or too easy to be boring. There can be more than one way to place any piece, the shortcut can be doing it more effectively, not having to move your hands too much. There usually aren’t shortcuts around hard work.
Key Quotes
Very often the shortcut to cracking the enigma in your own area of research is to take a detour through someone else’s seemingly unrelated domain. – PG 27
Data science is dangerous if it is not combined with a deep understanding of where the data comes from. – PG 32
Chapter 3 – The Calculated Shortcut
Main Point
To make things simple, you sometimes have to make things more complex to find the shortcut through all the noise. Finding a good shorthand way to represent ideas has been a shortcut throughout history. You probably already have a shorthand for your notes. Sometimes data in one form doesn’t reveal any insights but having it in a different form can generate new ideas.
Summary
Shortcut to Counting – Many different cultures developed their own form of counting. 40,000 years ago people started to put marks on the bone which we think is the first form of creating abstract numbers. The ancient Egyptians used a base 10 counting system like we do today. They had hieroglyphics instead of numbers. The Babylonians used a base 60 counting system. Why do we use 60 for minutes and seconds? We use Arabic numerals, but they learnt their system from the Hindu counting system so we should call it that. The Hindus also developed the number zero, for nothing. People in the west didn’t know why you should count nothing if there was nothing to count.
Black Mathematical Magic – Scottish Mathematician John Napier, born in 1550, was thought of as being involved in the occult-created Logarithm, making the task of multiplying two large numbers much simpler.
Mechanical Calculators – 17th-century Mathematician Gottfried Leibniz got the idea that there could be a machine to do arithmetic from seeing a pedometer work. He tried making them out of wood but eventually got a watchmaker to create his machine.
Through the Mathematical Looking Glass – 1551 Italian Mathematician Rafael Bombelli was reading a book of new formulas from Gerolamo Cardona. Up to this point, if you tried to square root a negative number you would just give up. Bombelli decided to leave the imaginary numbers in, and they cancelled out eventually leaving the correct answer. It sometimes helps to try different paths that could be out there to access a new way of thinking.
BA107… You Are Clear For Landing – German Physicist Heinrich Hertz, in 1877, discovered that radio waves were reflected by metal objects. His name is used in honour of that discovery of how fast waves vibrate. No one knows who made the radar – radio detection and ranging, but Scottish Physicist Robert Watson-Watt was surely involved. Tracking planes in war and in peacetime required great speed in figuring out where they were. The shape of the wave formed from the planes could be described by sines and cosines. Instead of having to figure out some complicated equation every time, there is a shortcut e^(iπ) +1=0 It is a curious intersection between imaginary numbers, exponential functions and wave functions.
Binary and Beyond – There are lots of ways to represent numbers and counting. We us base 10, there is base 20, base 60. Binary is another way to represent numbers. With items either being one (1) or off (0).
Pitstop: Start-Up – Sometimes it’s OK to break the law, depending on the law. Start-ups are innovating on disruption and sometimes that means pushing the limits of the law. The same in math, you have to break some laws sometimes. There needs to be a mix of ignorance and arrogance. You can’t know if the problem is impossible or if you won’t do it, and you need to think you can do it even if you never have.
Key Quotes
Instead of a potentially infinite amount of work, the pattern reveals that there is essentially only one act of labour needed. – PG 63
Chapter 4 – The Language Shortcut
Main Point
Look for the right language to think better. Can the change the picture into numbers? Can you change numbers into a graph or picture? Is the game you are playing just a different game in disguise? Can you find some bit of algebra to save you a lot of time?
Summary
Reframe – To find a shortcut, you can change the language you are using to describe the problem. I am sad can be changed to sadness is with me. Instead of being the sadness, the sadness has the chance to move away from you. Finding the correct language to describe something can create insight.
Mathematical Grammar – Algebra is important in most of the patterns shown. It allows you to go from the specific to the general. Instead of having to figure something out every time you can just apply the formula. It was created in the House of Wisdom in 810 by Muhammad ibn Musa al-Khwarizmi. The House of Wisdom collected and translated many ancient texts, it is why we have knowledge of ancient Greek, Babylonian, Egyptian, and Indian.
Lighting The Dark Labyrinth – 16th Century scientist Galileo Galilei said the universe is written in math and to understand it you need to understand math. He wanted to understand how objects fell, but they fell to fast so he had to make a ball roll down a hill. It would fall one unit in one sec then 3 units the next second, then 5 units the second after that. When he changed from looking at it as a number but as geometry, you could see the increase was going up in squares of t.
On the nth Day of Christmas – Changing the form of the problem can make it look different. Turning it from a geometric shape, a triangle, to a pyramid is the same problem, but looks completely different.
Descartes’s Dictionary – Your eyes can be tricked. Turning numbers into can reveal things, but also it can lie. You will want to explain the pattern you are seeing in the image with algebra to make sure it is correct. Descartes made a dictionary to translate between numbers and geometry. Sometimes the more complex the equation the more accurate the answer, however, big data can also lead you astray. Numbers and answers have to be backed up with analysis to see why the pattern should be described by that particular equation.
The Shortcut to Hyperspace – Descartes turned geometry into numbers. A square has 4 points on a graph with x and y coordinates. You can turn that into 3 dimensions to make it into a cube. You can also keep going to the nth dimension but you can’t visually represent them.
Winning at Games – Many games appear different but can actually be reimagined as another game that you can create a strategy to win with. Some games are just another version of tic tac too. The challenge might be the language of the game is limiting you from seeing how to win. If you go into another dimension it might unlock a way over that wall.
Pitstop: Memory – Memory champions can remember long strings of numbers and orders of playing cards. They don’t have great memories, they just have some tricks. Firstly, the memory place. We can remember a great deal of visual and spatial information. A memory palace exploits this ability by using a building as a framework to place memories. We are very visual so if you can make things colourful, shocking, or wild, we remember them more easily. President John Adams can be Adam and Eve kissing on a toilet (john). You can turn numbers, pairs or sets, into an image, so you don’t need to remember the numbers, just the image. Mnemonics is when you relate some word to something else. Our brain does better when we can associate things with something we already know. When you meet someone new with the same name as your friend, then imprint the new person to your friend, you will remember your friend and then remember the new person’s name.
Chapter 5 – The Geometric Shortcut
Main Point
Sometimes the straight line isn’t the fastest way between two points. Angles can help you measure things. Crowdsourcing ideas can make it easier to solve problems.
Summary
Getting from A to B – We have looked for shortcuts throughout history, actual shortcuts. in 1492 Christopher Columbus was trying to find a shorter way to get to India and thus make it easier to trade goods. The Suez Canal was first thought about by Napoleon, it was finally created in 1869 cutting the journey from London to the Arabian Gulf by 43%. In 1914, the Panama Canal was opened.
Around the World – Geometry has its roots in Greek, Geo meaning Earth and Metry meaning measuring. In 240 BC, Eratosthenes, the Librarian at the Great Library of Alexandria figured out the circumference of the earth. He heard that on certain days the sun would shine directly down a well in the city of Swenet. On the same day, he would plant a pole in Alexandria and measure the shadow to create a triangle. It had an angle of 7.2 degrees or 1/50th of a circle. Then he would need to find out how far away Swenet was from Alexandria and times it by 50. Even with basic tools, the measurement was surprisingly accurate.
Trigonometry: A Short Cut To The Heavens – You can use the power of the triangle to measure the stars. With a right-angle triangle, you only need one length and one degree to measure how far away something is.
Measuring The Measure – How do you create a measure? How do you get everyone to use the same measure? A rod was a Saxon word for the length of the first 16 men to leave church on Sunday’s left foot. The foot is an obvious measure but hard to keep consistent. King Henry, I tried to solve the problem by using his body as the measure, but it was hard to get him to use him as a measuring tool. In France, the revolution was happening and a more equalitarian measure was desired. It was going to be one ten-millionth of the distance from the pole to the equator. Scientists Pierre Mechain and Jean-Baptiste Delambre were charged with measuring the distance. They didn’t actually measure that distance. They went from Dunkirk to Barcelona where they used triangles to measure from one high point and used a tool called a Borda repeating circle to find the angle. Then from the new high point, they already had the length and they just had to find the angles again. Then they extrapolated the answer like Eratosthenes. The French Academy made a standard meter in 1799 out of platinum.
From London to Edinburgh – Where should you meet if 5 people are in London and 10 people in Edinburgh. You would think 2/3s from London, but the answer is actually Edinburgh. For every mile the 5 have to move, saves the 10 ten miles so it is best they don’t move at all.
Desire Paths – Planners will make paths around parks, schools, and streets but people will find shortcuts to where they want to go. The path will create itself and these are called Desire Paths. Letting users generate ideas is what Facebook, Google, and Amazon do. They are following the Desire Paths created. Planners now use these signs to see unused areas of public spaces which can be better used since no one walks on them.
Geodesics – When you look at a globe, you would think the fastest way between two points is a straight line, but that doesn’t take into account the curvature of the earth. The true desired path, the shortest path, is a curve. These curves mean that some triangles can have more or less than 180 degrees. The curve of the line in the triangle changes the degrees inside the triangle. Gauss considered this idea of light bending to find the shortest path but he wasn’t thinking at a big enough scale to detect it so he abandoned the idea. It wasn’t until Albert Einstein’s theory of gravity and the geometry of space-time that would prove Gauss right. Einstein’s big breakthrough was that you had to consider time and space together in 4 dimensions. How you moved changed the observation of distance. How light bent around large objects, not in straight lines but in curves leads to the theory of wormholes, a speculative theory that connects two bits of the universe together in a way that would take forever to go between if you went in a straight line.
Pitstop: Journeys – Philosopher Ludwig Wittgenstein used the word Denkbewegungen meaning ‘thought-ways’ to describe a major breakthrough in his work he got while walking through the Norwegian Countryside, he said ‘It seems to me I have given birth to new thoughts within me.’ Sometimes the shortest route isn’t the best route. Climbing mountains, climbers go up and down the mountain to find the easiest way rather than the shortest distance.
Key Quotes
The shortcut can be a wonder but also a peril – Robert MacFarlane – PG 141
Chapter 6 – The Diagram Shortcut
Main Point
You can show a great deal of information visually. Different graphs and charts can communicate differently and more effectively than words.
Summary
Images – We have only had the written word for a short time compared to images conveying meaning. An image can be a great shortcut to get your point across, it is worth a thousand words after all.
The Rose Diagram – Florence Nightingale was horrified by the conditions she found the sick soldiers in during the Crimean War in 1854. The hospital was in terrible condition, it was a cesspool. Nightingale tried to improve systems to make the place more hygienic but deaths continued to rise. After struggling for months, two men came to visit the hospital, Dr John Sutherland, a cholera specialist, and Robert Rawlinson, a sanitary engineer. They found the issue was the water system. It had dead animals and human waste in it. They flushed the system and made upgrades and the deaths went down. Within a year, deaths from infectious diseases went down by 98%.
After the war, Nightingale got an audience with Queen to talk about the need for an inquiry into the deaths of soldiers in hospitals. They did not want to do the inquiry but Nightingale had such a good reputation they let her do one that was going to be a confidential report.
She was afraid the government would ignore her figures so she created a graph that would be called the Rose Diagram.
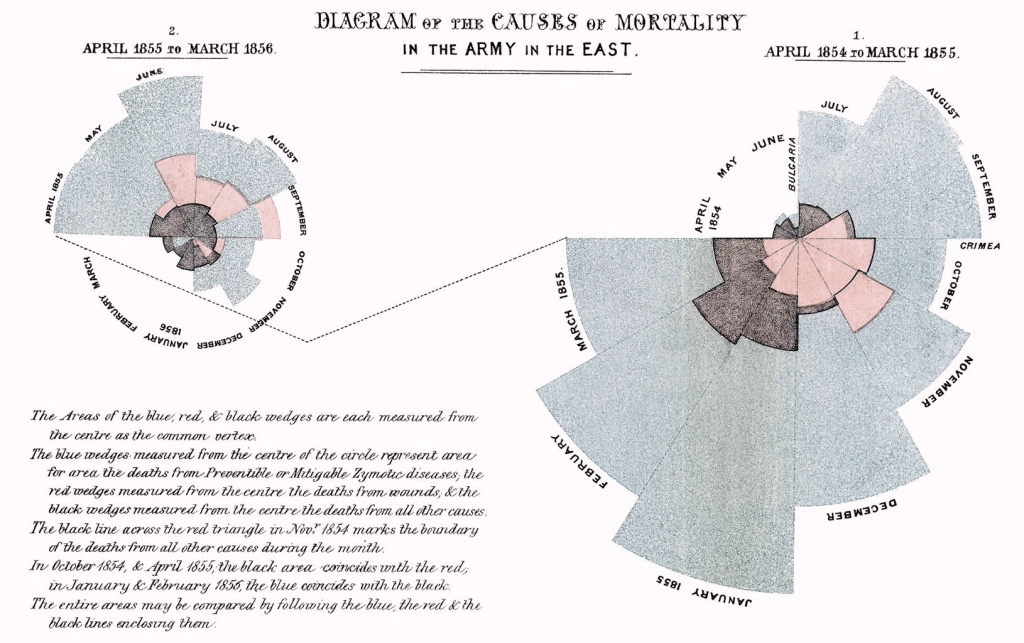
It visualized the number of deaths for war and other factors. It threw into the light the number of people dying from preventable causes (Blue areas) vs fighting (Brown)
The graph catches your eye and shows you the difference better than reading a paper with words. It provides a visual shortcut to the ideas that can be easily replicated and more readily understood than having lots of people read the report.
Map Making – A map is a great example of a shortcut in diagram form. It is a scaled-down version of the land with only the essential features remaining. 16th-century Dutch cartographer Gerardus Mercator is generally credited with finding the solution to show a two-dimensional map of the Earth. The point of the map was to help sailors get from point A to point B and if they knew the fixed direction they needed to go they could use a compass to get there.
How the map was made kept the angles between the lines around the map correct, it didn’t represent the real; the size of countries, or the distance between them. This had large political implications because people thought that certain countries were smaller and so less significant. Africa for example is made to look much smaller than it actually is. The US looks much larger than it is. The issue is that all maps are going to make compromises somewhere.
The point of a map is to quickly convey some information. A good example of this is Harry’s Becks 1933 map of the London Underground. It gets rid of size, and direction, and focuses on how the network is connected. It was not well received when it was first submitted.
Mapping the Big and the Small – The power of a diagram is that it helps reveal how things work by removing items to show insight. In 1543, Polish mathematician and astronomer Nicolaus Copernicus used the diagram to explain what his opus De revelutionibus orbium coelesium took 405 pages to explain.

The sun is the centre of the solar system and not the earth. He knew that the concentric rings weren’t circles and that the distance between the planets wasn’t accurate, but the image did translate to the viewer that everything went around the sun.
This was diagraming the very big, diagrams are also used to detail the very small. Chemistry uses letters and lines to detail the connection between elements to form compounds. The structure of DNA created which is now synonymous with science helped people understand the double helix structure. In1948, physicist Richard Feynman wrote on the board at a meeting for theoretical physicists a diagram of how light and matter interacted. It replaced a lot of math and people rejected it. Today, it is diagrams like that that are the first place theoretical physicists go to when trying to understand what is happening when particles interact.
Venn Diagrams – The diagram named after British mathematician John Venn in 1880 is a clever way to show different possibilities.
Pitstop: Economics – Kate Raworth redrew how economics looked in her book Doughnut Economics. Economics up to this point was supply and demand curves. It was all money-related. She added people and places. How economics directly affects us and our environment. Sometimes one simple number is helpful. You remove all of the noise and get a pure signal. But what if you are removing important information that might be relevant. A dashboard can help because it shows more than just one thing. Raworth says “The shortcut might be leading you down an extremely dangerous hole.” And as mathematician George Box said – “All models are wrong, but some are useful.”
Chapter 7 – The Differential Shortcut
Main Point
Calculus can be used to find the optimal solution for a problem. Sometimes it would be beneficial to find a mathematician to find the best option, but you can also look at nature for solutions.
Summary
Falling to Earth – February 20, 1962, the numbers had to be correct. The person doing the numbers was Katherine Johnson, who was made famous by the film Hidden Figures, about a group of female mathematicians who worked for NASA and were instrumental in doing the math to get astronaut John Glenn safely back to earth.
They used calculus, which Richard Feynman called “the language God talks”. This discovery by Isaac Newton and Gottfried Wilhelm Leibniz helped kick off the scientific revolution and create shortcuts to how to understand the world.
A Universe In Flux – The plague had hit Cambridge and Isaac Newton was at his house in Woolsthrope Manor in Lincolnshire. He wanted to make sense of telling how fast an item was moving at any particular point. The story is it was an apple. He knew from Galileo that you could tell where an object was at time t but you couldn’t tell how fast it was going. His solution solved that and created calculus at the same time. He didn’t publish his findings, he just used them for his 1687 treatise Principia Mathematica.
Maxing Out – Pierre de Fermat, of his Last Theorem fame figured out how to use calculus to find the optimal solution to a problem. Calculus can tell you the speed at a certain point, but it can also tell you the maximum area or ingredients, or whatever you want. Rather than doing the math, you can just figure out where the tangent to the curve is 0, which will be the highest point.
Mathematical Scaffolding – Architect Christopher Wren used calculus to make domes work on his buildings. When you hang a rope from two points it hangs in the state with the lowest possible kinetic energy. Wren knew if you invert this curve it will be able to support its own weight.
He used this at St Paul’s Cathedral to make three domes appear as one. One inner dome, A middle supporting dome, and the other dome. If you hang a weight on a rope, that curve can support the weight on top of it if you invert it. Leibniz used calculus to find the curve with the least potential energy, this curve is called a catenary.
Rollercoaster – The fastest path between two points might not be a straight line. Dropping a ball from point A to get to point B actually goes faster when it uses a cycloid. The ball will drop below the level of B so it can pick up even more speed.
Do Dogs Do Calculus? – Nature tends toward optimising energy. Light finds the shortest path. Animals appear to be very good at finding paths that use the least energy. We can use calculus to do the same.
Chapter 8 – The Data Shortcut
Main Point
Too much data can be overwhelming and too little can lead you to be uninformed. Stats help you use a smaller amount of information to get a better understanding of the whole.
Summary
To Much Data – We now make more data in two days than all the data collected from the start of Man to 2003. We need a way to sort and understand it. Most data will fit in a Gaussian Distribution, or what is commonly known as the Bell Curve. Most data points are in the middle and few are to either extreme edge.
8 Out Of 10 Cats – You can use a small number of responses to understand the population’s preference to a certain level of accuracy. The more accurate you want to be the greater the sample size needs to be. This level of accuracy or P score can also lead you astray, just because you are within a certain level doesn’t guarantee the results are correct.
Wisdom Of The Crowd – You can get a number of people to estimate a result and they can be shockingly accurate on average. They can be led astray with anchoring answers before they make their own. Independent answers are usually better but sometimes conferring with others and having actually knowledgeable people in the group can lead to better overall results.
Who Wants To Be A Scientist – The power of the crowd has been used in many scientific experiments. Oxford University ran the Galaxy Zoo project. They needed people to look at images of space and confirm what each galaxy was, spiral or spherical. There were so many photos the University didn’t have enough people to go over them all. The volunteers actually found another shape, the green pea galaxy.
Machine Learning – Computers have gotten a lot smarter and now you can train code to learn. The issue is that they reach a certain level and then more data doesn’t help them to get more accurate. Too many data points can also lead you astray. Amazon used their own employees as models of an HR algorithm, but it rejected non-white 20 years old’s, revealing issues within its current system.
How Much Data Before You Make Up Your Mind – You want to get 1/e or 37% of the information before making a decision. After you have seen 37% off the offers you want to take the next offer that beats all the previous offers to have a 1/3 chance of getting the best offer.
Chapter 9 – The Probable Shortcut
Main Point
Intuition can lead us a stray. Probability can give you a better chance of success when you can have a more accurate understanding of the future and the uncertainty you are facing.
Summary
Probability – Pierre de Fermat and Blaise Pascal started using mathematics to understand probability.
What Are The Chances Of That? – Fermat and Pascal created the theory of probability. Instead of testing how many times a dice roll would come out as a certain result, you could just do the math. Getting a 7 with 2 dice is a 1/6 chance. So the chance of not getting a 7 is 5/6. You can then just multiple the chances to see how likely it is to get a 7 with x amount of dice rolls.
A Cunning Shortcut: Consider The Opposite – Instead of finding the answer, which might be complex, you can look at the inverse of the question and then just subtract that from 1 to get the answer you were looking for.
The Shortcut To The Casino – The casinos are always trying to find an edge. They make their games in their favour so in the long run, they win. You can use probability to gain an edge or a better outcome in the short term but generally, they always have the advantage so it is better to put it all on one hand than drag it out.
Entry Fee – If you can work out the expected return of a game and someone offers you less than that to play it you should. If the return is $2 and the probability is 0.5 and they offer you less than $1 to play you should. But some games get better returns as the probability changes so theoretically you should play at any price. The problem is that the return might not be a good measure but what the prize is worth to you. The St Petersburg paradox explains why no rational person will play the game at any price.
Goat and Cars – There was a game show called Let’s Make A Deal that had 3 doors, behind 2 doors were goats and behind the other was a car. You would pick one door and the host would show you a door with a goat behind it. Then you were asked if you wanted to pick the other door, or the one you originally picked. It caused many fights between mathematicians. You got better odds choosing the other door.
The Reverend Bays – We are not good at uncertainty and probability and it often gets misused. A 20% increase in x doesn’t mean that it goes up from 5% to 25% it means it goes from 5% to 6%.
Chapter 10 – The Network Shortcut
Main Point
When you have different points that are connected, you have a network. It can be helpful to understand what your network to figure out the shortcuts inside it.
Summary
Read Euler. Read Euler. He is the Master Of Us All – There are 7 bridges that connect an island in the middle of the River Pregel. The locals would have a Sunday tradition of trying to walk through the city but only going over each bridge once.
The Bridges of Konigsberg – Euler didn’t try to work out all of the possibilities to walk over the bridges. He looked at the shortcut to understand if it was even possible. For the journey to be achievable, not more than two points could have odd numbers of bridges connected to it. The start and the end of the journey.
Human Heuristics – The key was that Euler got rid of any information that didn’t help. The size or length of the bridge didn’t matter. What matters was the relationship between the bridge and the land. Humans do this same thing with Heuristics found by psychologists Amos Tversky and Daniel Kahneman. The three main mental shortcuts we use are Representativeness – finding patterns between different ideas. Anchoring and Adjustment – The first piece of information changes how we perceive or judge the next one. Finally, Availability uses local knowledge to judge a more general situation.
Internet Shortcuts – Search is used to mean looking for the words in the website. This was an easy system for the game. Google used an idea of the importance of the site and they had to use the relevance of other sites in relation to it to see where it ranked. They used some mathematics called the eigenvalue of a matrix. It figures out what settings a system will remain stable so instead of needing to iterate you can find the page rankings more easily.
Social Shortcuts – The 6 degrees of separation were popularised by John Guare in his play with the same name. It explains that everyone is connected by just six people. This is called a Small World connection. Where many nodes are connected by a few. This is how airports work. Hubs connect to the smaller airports so you can get from one small one to another pretty easily.
Gauss’s Brain – Looking at ‘supernormal’ brains have found structural differences in people’s brains. There are hedgehogs that look deeply at one subject and have lots of short connections. There are foxes that have lots of long connections and think widely and outside of the box. It is somewhat impossible to have both but you can collaborate. Learn from someone from a different field to see things differently. A new language, framework, and style can be applied to your field for unique discoveries.
Chapter 11 – The Impossible Shortcut
Main Point
Sometimes there are no shortcuts and you have to do the work. You can try to change the problem into another problem to see if there is a shortcut for that. Or you can try to exploit some other way of thinking about the problem.
Summary
The Travelling Salesman – Some problems don’t have shortcuts. You need to put in the hard work of trying all the options.
What Is A Short Cut? – A short cut is when more factors get added so the solution doesn’t take long to figure out. There should be an equation or algorithm that you plug in the N (number) and it will give you an answer.
A Shortcut To A Shortcut – You might be able to find a shortcut that is faster than what we currently have but it might still actually take a long time. Computers are only so fast so some shortcuts will still take millions of years.
Exploiting The Lack Of Shortcuts – Code makers want to use the idea of shortcuts to make codes that don’t have shortcuts. Making them unbreakable. But even with codes that would take millions of years to brute force, you can see pathways to the answer. A substitution cypher was figured out by ninth-century polymath Ya’quab al-Kindi, who figured out frequency analysis. Some letters appear more often than others, or in sequence, so Q is followed by U. This made the number of possibilities much smaller. Alan Turing did something similar in WW2 with the German Enigma code.
Prime Suspects – Credit card companies and websites use large primes to make larger numbers to secure payments. Finding what is or isn’t a prime is a challenge, figuring out what two large primes made up the secure number is even harder.
Quantum Shortcuts – Normal computers use bits that are either on or off, 0 or 1. Quantum computing uses qubits and they can be in quantum superpositions where they are on and off at the same time. The issue is that once they are observed they will take a position. Also, we need special computers to run this new algorithm. If we can get these computers to work they will be astronomically faster than current computers.
Biological Computing – Leonard Adleman used DNA to figure out a Hamiltonian Path Problem. How do you get from city to city by only going to each city once? The DNA want to match with their peers A to T and C to G. So he made sequences for each city and then could filter out what pairs matched up. Researchers in Sapporo did a similar thing with a slime mould called Physarum polycepalum. It likes to eat oat so the researchers set up a replica of the Tokyo railway system with oat flakes as nodes. It took the slime about a day to figure out the most efficient way to set up the grid that took engineers years.
Interested in supporting my page by purchasing this book, click here
